Perceptron
Definission
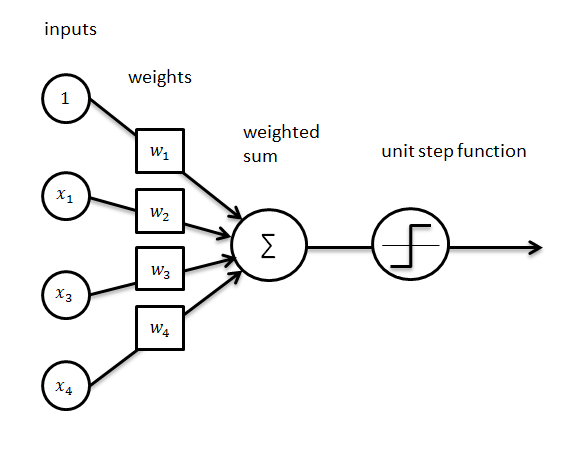
The perceptron is an algorithm for supervised learning of binary classifiers. It is a type of linear classifier, i.e. a classification algorithm that makes its predictions based on a linear predictor function combining a set of weights with the feature vector.
Implementation
The purpose of this example is to find if a point is above or below a defined line with an affine function. This algorithm uses the gradient descent algorithm associated with a perceptron to learn how to classify the data. See Linear Regression for more informations about gradient descent
import random
First we can define or activation function, the purpose to this function is to "activate" or not a neuron. In this case, we just active if the number is greater than 0
def activationFunc(number):
    return 1 if number > 0 else -1
Create the perceptron class, we want to send the input size and the learning rate (In machine learning section) at the instanciation
class Perceptron:
    def __init__(self, size, learning_rate, activ_func):
        self.size = size
        self.weights = []
        self.lr = learning_rate
        self.activ_func = activ_func
        self.initialize_weigth()

    def initialize_weigth(self):
        for i in range(self.size):
            self.weights.append(random.uniform(-1.0, 1.0))

    #This is our guess function using weighted sum of input
    def guess(self, inputs):
        sum = 0
        for i in range(len(self.weights)):
            sum += inputs[i] * self.weights[i]
        return self.activ_func(sum)

    #This is the train function, witch is update the perceptron weight by calculating the error with target - guess
    #This is the application of linear regression with a custom learning rate
    def train(self, inputs, target):
        value = self.guess(inputs)
        error = target - value
        for i in range(len(self.weights)):
            self.weights[i] += error * inputs[i] * self.lr

    def valid(self, inputs, target):
        value = self.guess(inputs)
        error = target - value
        return (error == 0)

    def getY(self, x):
        m = - self.weights[0] / self.weights[1]
        b = - self.weights[2] / self.weights[1]
        return m * x + b
Create the point class, we initialize a point with random position between -1 and 1, we feed also a label function in order to calculate the error during the training
class Point:
    def __init__(self, func):
        self.x = random.uniform(-1.0, 1.0)
        self.y = random.uniform(-1.0, 1.0)
        #Point is above the line
        if (self.y > func(self.x)):
            self.label = 1
        #Point is below the line
        else:
            self.label = -1
        #Bias is needed to avoid to get stuck on zero in the weight computation
        self.bias = 1
#Global counter
total_iteration = 0

#Create bunch of point
def initialise_data(size, function):
    data = []
    for i in range(size):
        data.append(Point(function))
    return data

#Create run function
def run(data, number_iteration, learning_rate):
    return run_trained(data, number_iteration, Perceptron(3, learning_rate, activationFunc))

#Create trainer functin
def run_trained(data, number_iteration, perceptron):
    global total_iteration
    total_iteration += number_iteration
    print("Training start for {0} iteration{1}...".format(number_iteration, 's' if number_iteration > 1 else ''))
    for i in range(number_iteration):
        for point in data:
            inputs = [point.x, point.y, point.bias]
            #Call perceptron.train with current point data as input
            perceptron.train(inputs, point.label)
    print("After {0} iterations".format(total_iteration))
    return perceptron

#Calculate the success percentage of a perceptron
def calculate_success_percentage(data, perceptron):
    trues = 0
    for point in data:
        inputs = [point.x, point.y, point.bias]
        if (point.label - perceptron.guess(inputs) == 0):
            trues += 1
    return trues / float(len(data))

#Print the success percentage
def print_success_percentage(number):
    print("Success : {0} %".format(number))
from plotly import __version__
from plotly.offline import download_plotlyjs, init_notebook_mode, plot, iplot

init_notebook_mode(connected=True)

import plotly.plotly as py
import plotly.graph_objs as go
import plotly.figure_factory as FF

print (__version__) # requires version >= 1.9.0
def display_current_state(data, perceptron, func):
    px = []
    py = []
    colors = []
    for i in range (0, len(data)):
        px.append(data[i].x)
        py.append(data[i].y)
        colors.append('rgba(76, 175, 80, 0.95)' if perceptron.valid([data[i].x, data[i].y, data[i].bias], data[i].label) else 'rgba(244, 67, 54, 0.95)')
    #Define dot traces
    trace = go.Scatter(
        x = px, y = py,
        name= 'Points',
        mode='markers',
        marker=dict(
            color=colors,
            line=dict(
                color='rgba(0, 0, 0, 1.0)',
                width=1,
            ),
                symbol='circle',
                size=10,
            )
        )
    xTab = [-1, 1]
    #Y = M * X + B
    yTab = [func(-1), func(1)]

    #Define best fit trace
    trace1 = go.Scatter(
        x = xTab,
        y = yTab,
        name = 'Best fit',
        line = dict(
            width = 2,
            color = 'rgb(69, 32, 39)'
        )
    )

    xTab1 = [-1, 1]
    #Y = M * X + B
    yTab1 = [perceptron.getY(xTab1[0]), perceptron.getY(xTab1[1])]
    #Define best fit trace
    trace2 = go.Scatter(
        x = xTab1,
        y = yTab1,
        name = 'Best fit predicted',
        line = dict(
            color = 'rgb(103, 58, 183)'
        )
    )

    #Define the layout
    layout = go.Layout(
        title='Random points and current best fit',
        plot_bgcolor='rgb(230, 230,230)',
        showlegend=True,
        xaxis=dict(range=[-1, 1]),
        yaxis=dict(range=[-1, 1])
    )


    #Draw the final graph
    fig = go.Figure(data=[trace, trace1, trace2], layout=layout)
    iplot(fig, filename='dot_Jan')
if __name__ == "__main__":
    # y = mx + b
    func = lambda x : 1.5 * x + 0.74
    size = 1000
    data = initialise_data(size, func)
    p = run(data, 1, 0.001)
    percent = calculate_success_percentage(data, p) * 100
    print_success_percentage(percent)
    display_current_state(data, p, func)
    while percent != 100:
        p = run_trained(data, 5, p)
        percent = calculate_success_percentage(data, p) * 100
        print_success_percentage(percent)
        display_current_state(data, p, func)